Project
Air Quality Analysis
An exploratory analysis of Pune air-quality sensor data to identify pollution hotspots, daily patterns, and intervention opportunities.
Problem
Pune has multiple air-quality monitoring stations, but raw sensor readings are difficult to turn into decisions. This project analyzes more than 103,000 readings from 10 stations to answer a practical question: where is air quality consistently worse, when does exposure spike, and what patterns are strong enough to act on?
Dataset Snapshot
| Metric | Value |
|---|---|
| Data points | 103,000+ |
| Monitoring stations | 10 |
| Parameters tracked | 28 |
| Time period | May-Aug 2019 |
Findings
Transport corridors dominate the ranking
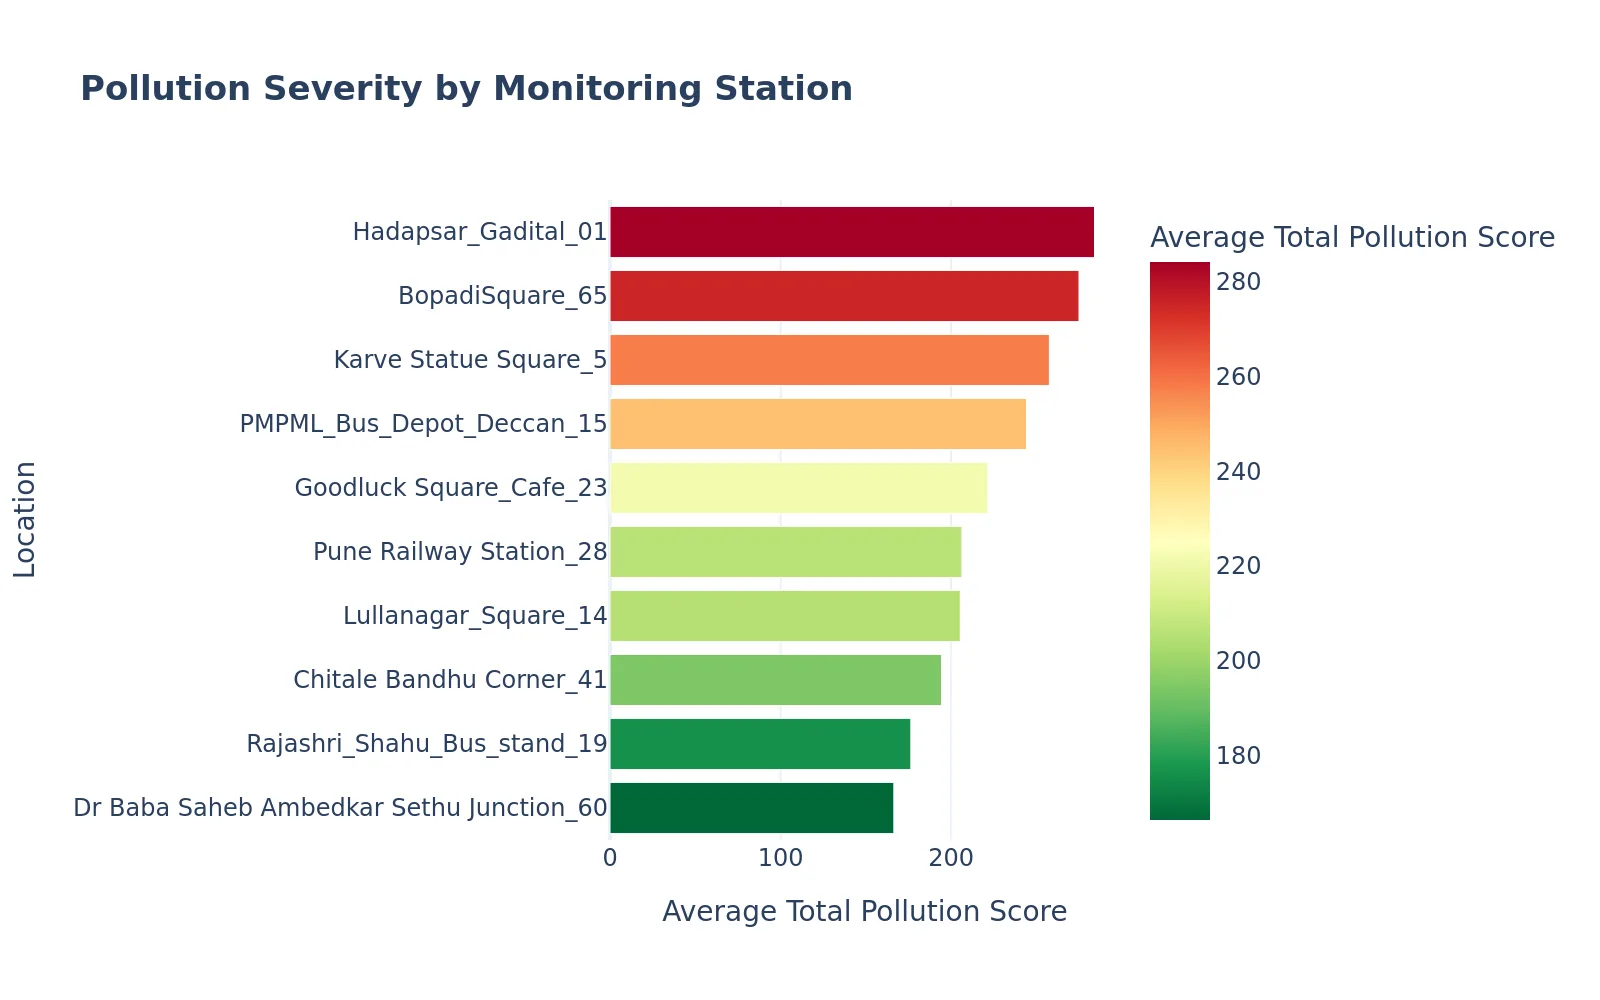
Hadapsar Gadital and Pune Railway Station stand out as the most polluted locations in the dataset. Both are traffic-heavy areas, which makes them good candidates for targeted interventions instead of city-wide blanket measures.
Morning commute hours are the main risk window
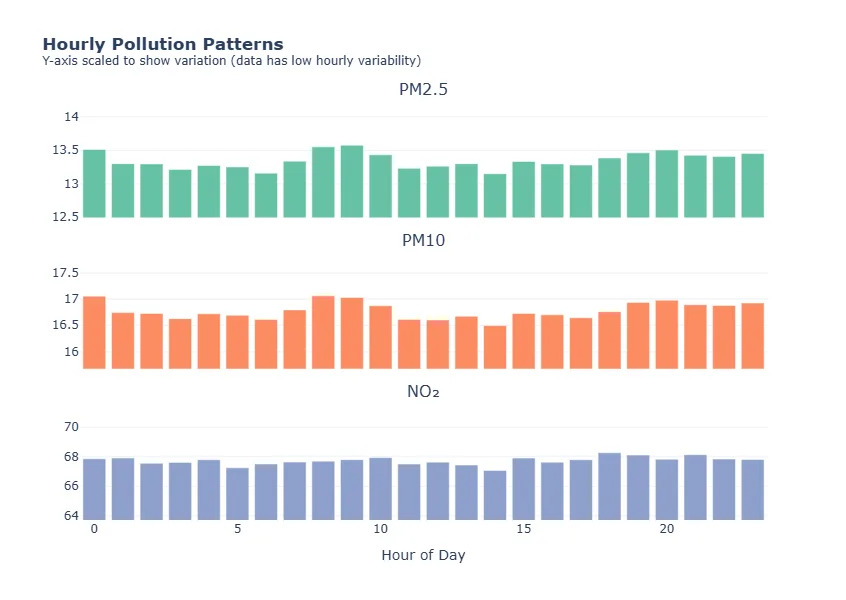
PM2.5, PM10, and NO2 all spike between 8 AM and 10 AM, aligning with daily commute patterns. This matters more than a daily average because it points to the hours when people are most likely to face the worst exposure.
| Time | Risk level | Practical takeaway |
|---|---|---|
| 5-7 AM | Low | Best window for outdoor activity |
| 8-10 AM | High | Avoid outdoor exertion where possible |
| 12-4 PM | Moderate | Conditions vary by location |
| 10 PM+ | Low | Safer than peak commute hours |
Weekends show a measurable drop
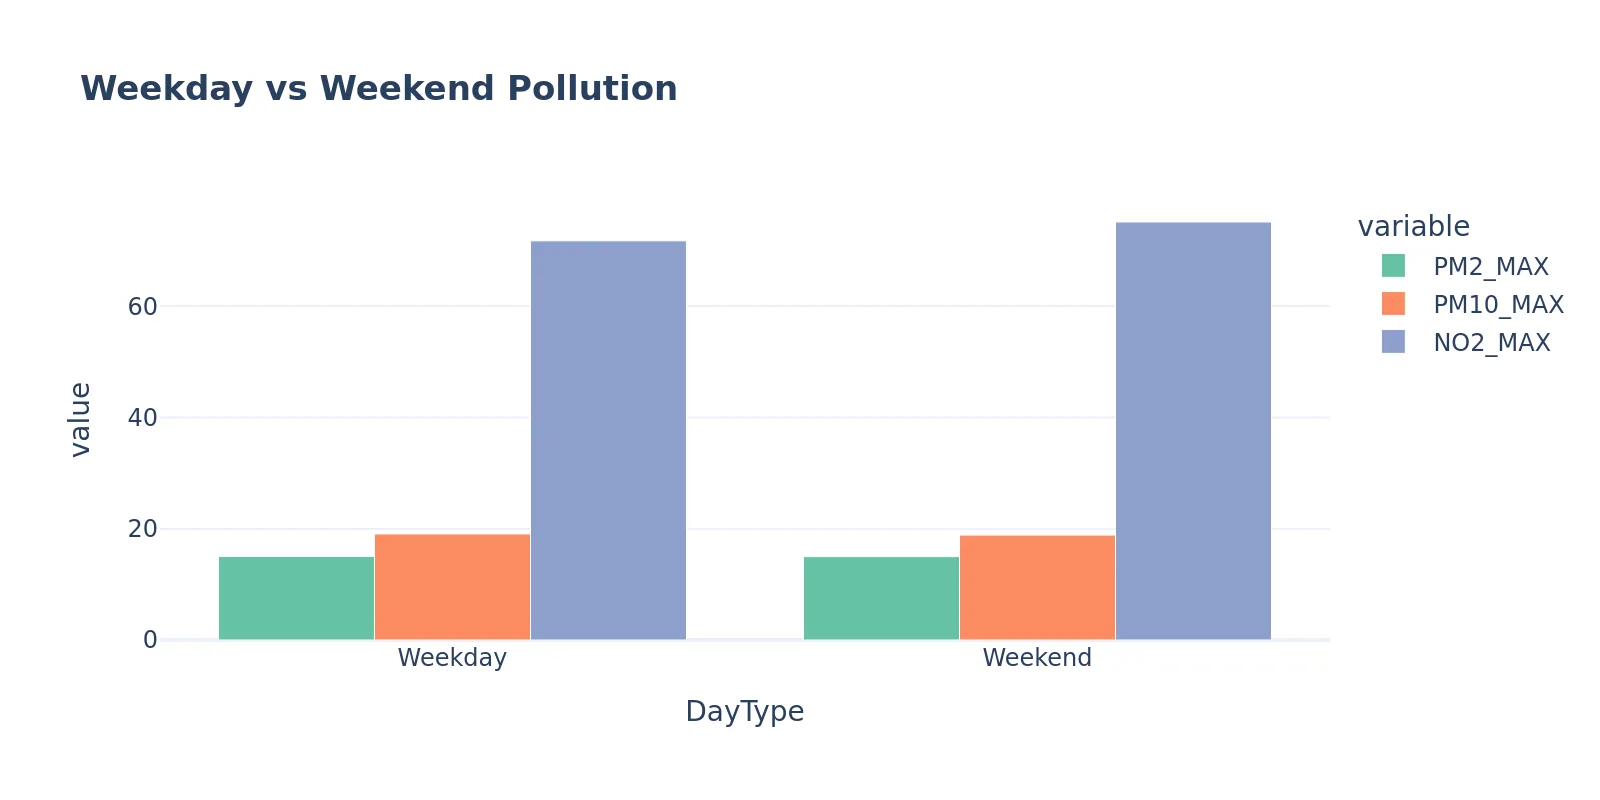
Pollution falls by roughly 15% on weekends, which strengthens the case that traffic is one of the main drivers. That gives city planners a cleaner signal than general assumptions about “urban pollution.”
Clustering separates chronic hotspots from occasional spikes
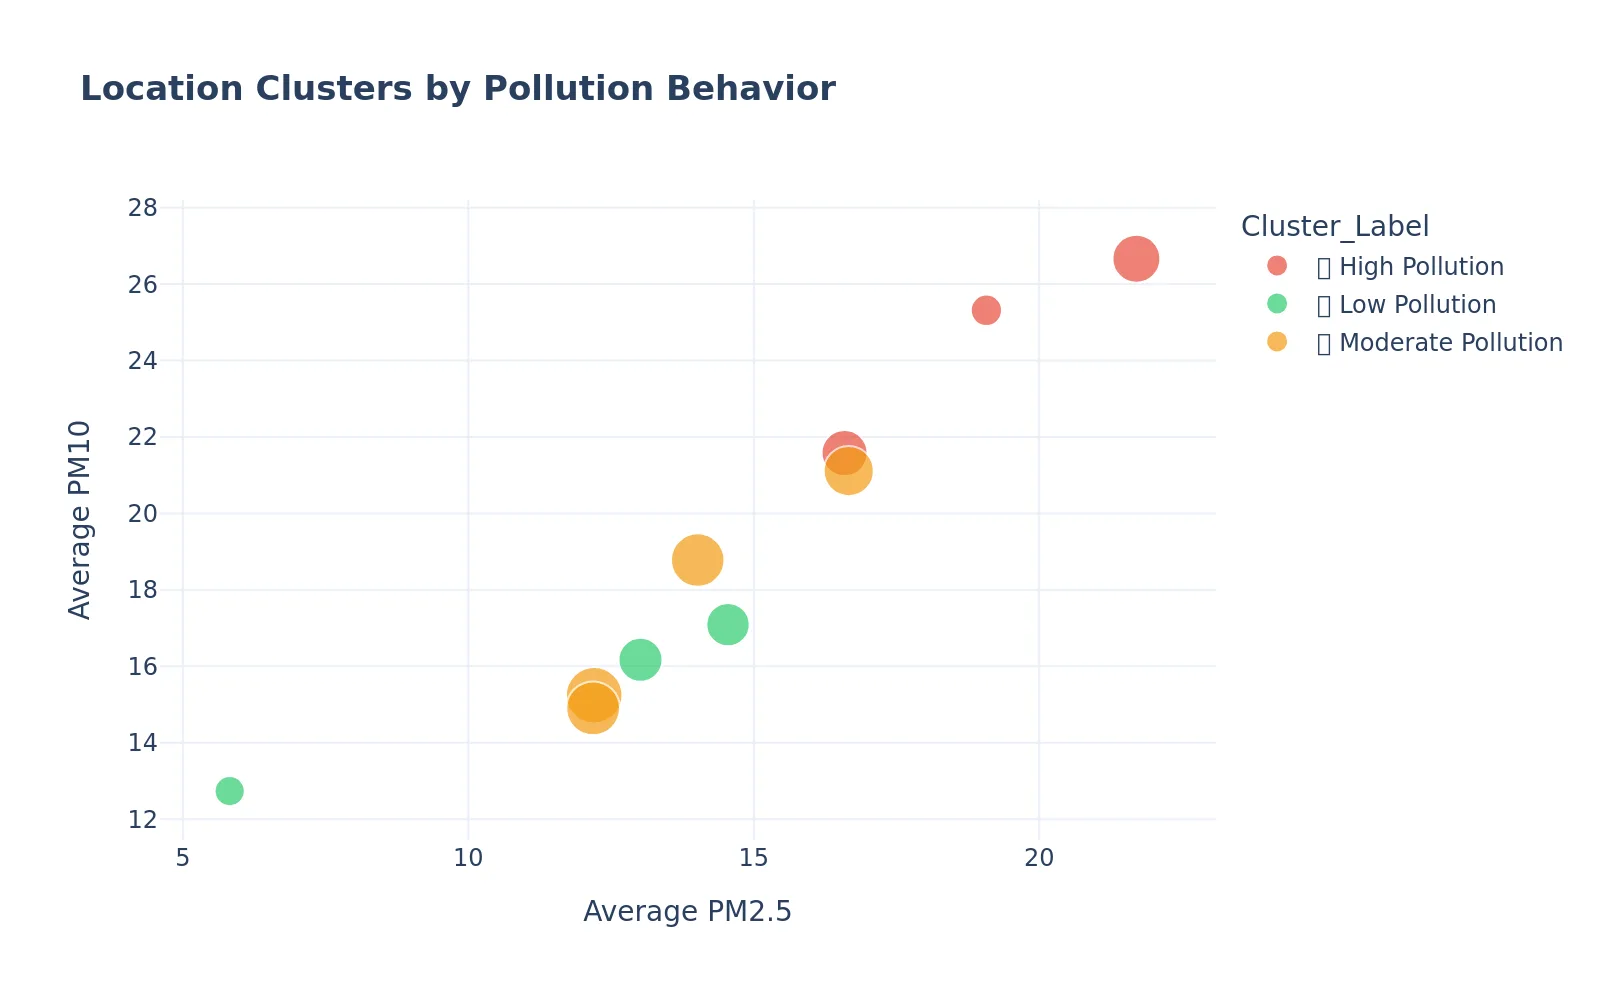
K-means clustering split the stations into three practical groups:
| Zone | Meaning | Suggested response |
|---|---|---|
| Green | Usually clean | Maintain current conditions |
| Caution | Spikes at certain times | Increase monitoring and alerts |
| Hotspot | Persistently poor air quality | Prioritize mitigation |
Pollutants move together
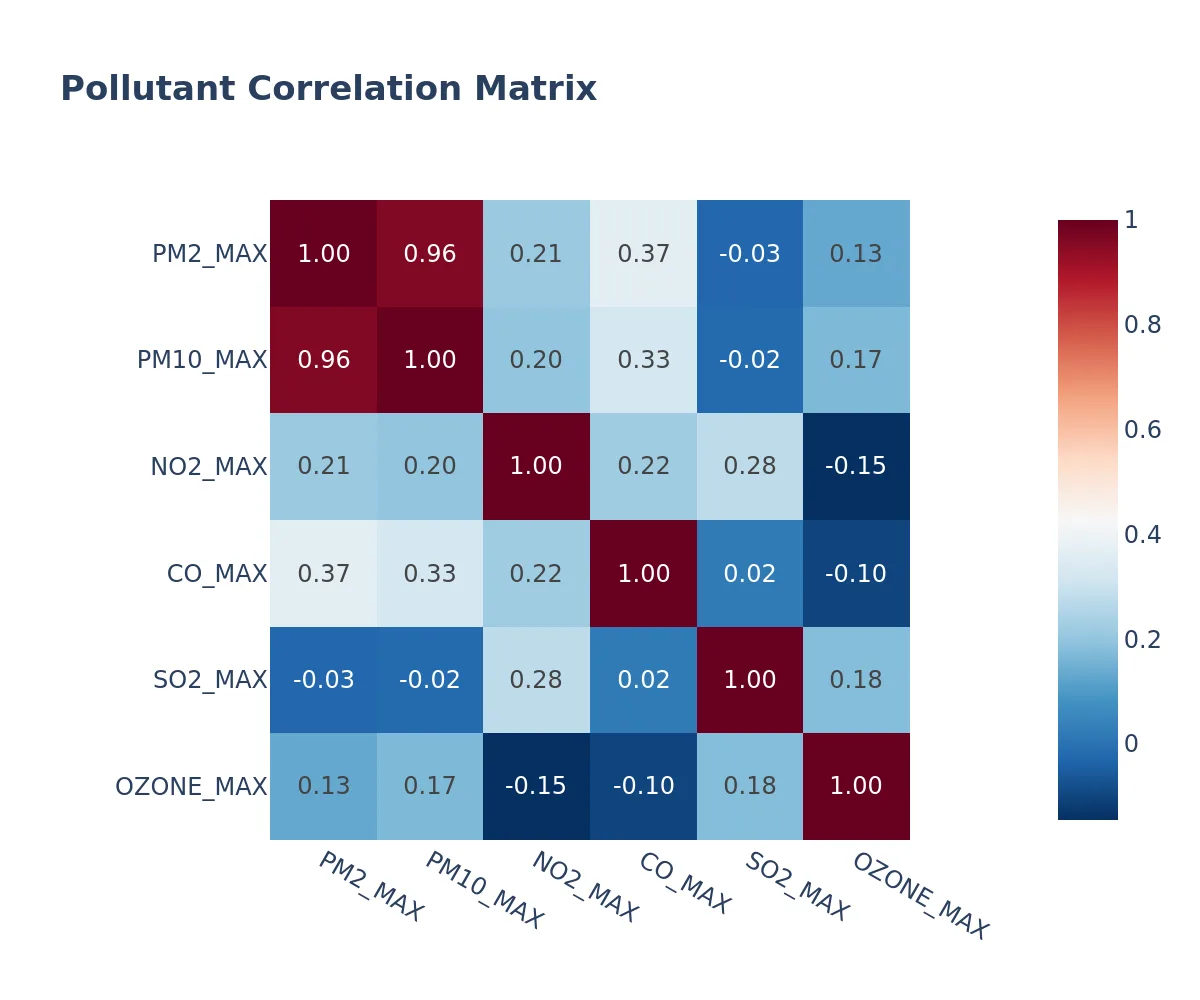
PM2.5 and PM10 are strongly correlated, which suggests they often come from the same sources, such as traffic and dust. That matters because one well-targeted intervention can improve more than one metric at once.
What This Suggests
- Focus enforcement and mitigation near transport-heavy locations first.
- Treat the morning commute window as the highest-priority exposure period.
- Use weekend deltas as evidence when evaluating traffic-related policies.
- Group stations by behavior, not just absolute averages, when deciding where to invest.
Approach
| Step | What I did |
|---|---|
| Data cleaning | Parsed timestamps, handled missing values, flagged bad readings |
| Exploratory analysis | Compared stations, time windows, and weekday/weekend shifts |
| Correlation analysis | Measured how pollutants move together |
| Clustering | Grouped stations by pollution behavior |
| Threshold comparison | Checked readings against NAAQS-style limits |
Outcome
The result is a notebook-based analysis that makes the dataset easier to reason about for both residents and planners. Instead of a generic “air quality is bad” conclusion, it points to specific places, times, and policy levers that deserve attention.