Project
Workforce Pulse: HR Analytics Dashboard
A Power BI dashboard for tracking workforce mix, promotion readiness, layoffs, and satisfaction across an HR dataset.
Problem
HR datasets often contain enough information to spot retention, promotion, and organizational-structure issues, but the raw tables are not easy to work with in day-to-day decision making. This dashboard turns that dataset into a clearer operating view for HR and department leaders.
Snapshot
| Metric | Value |
|---|---|
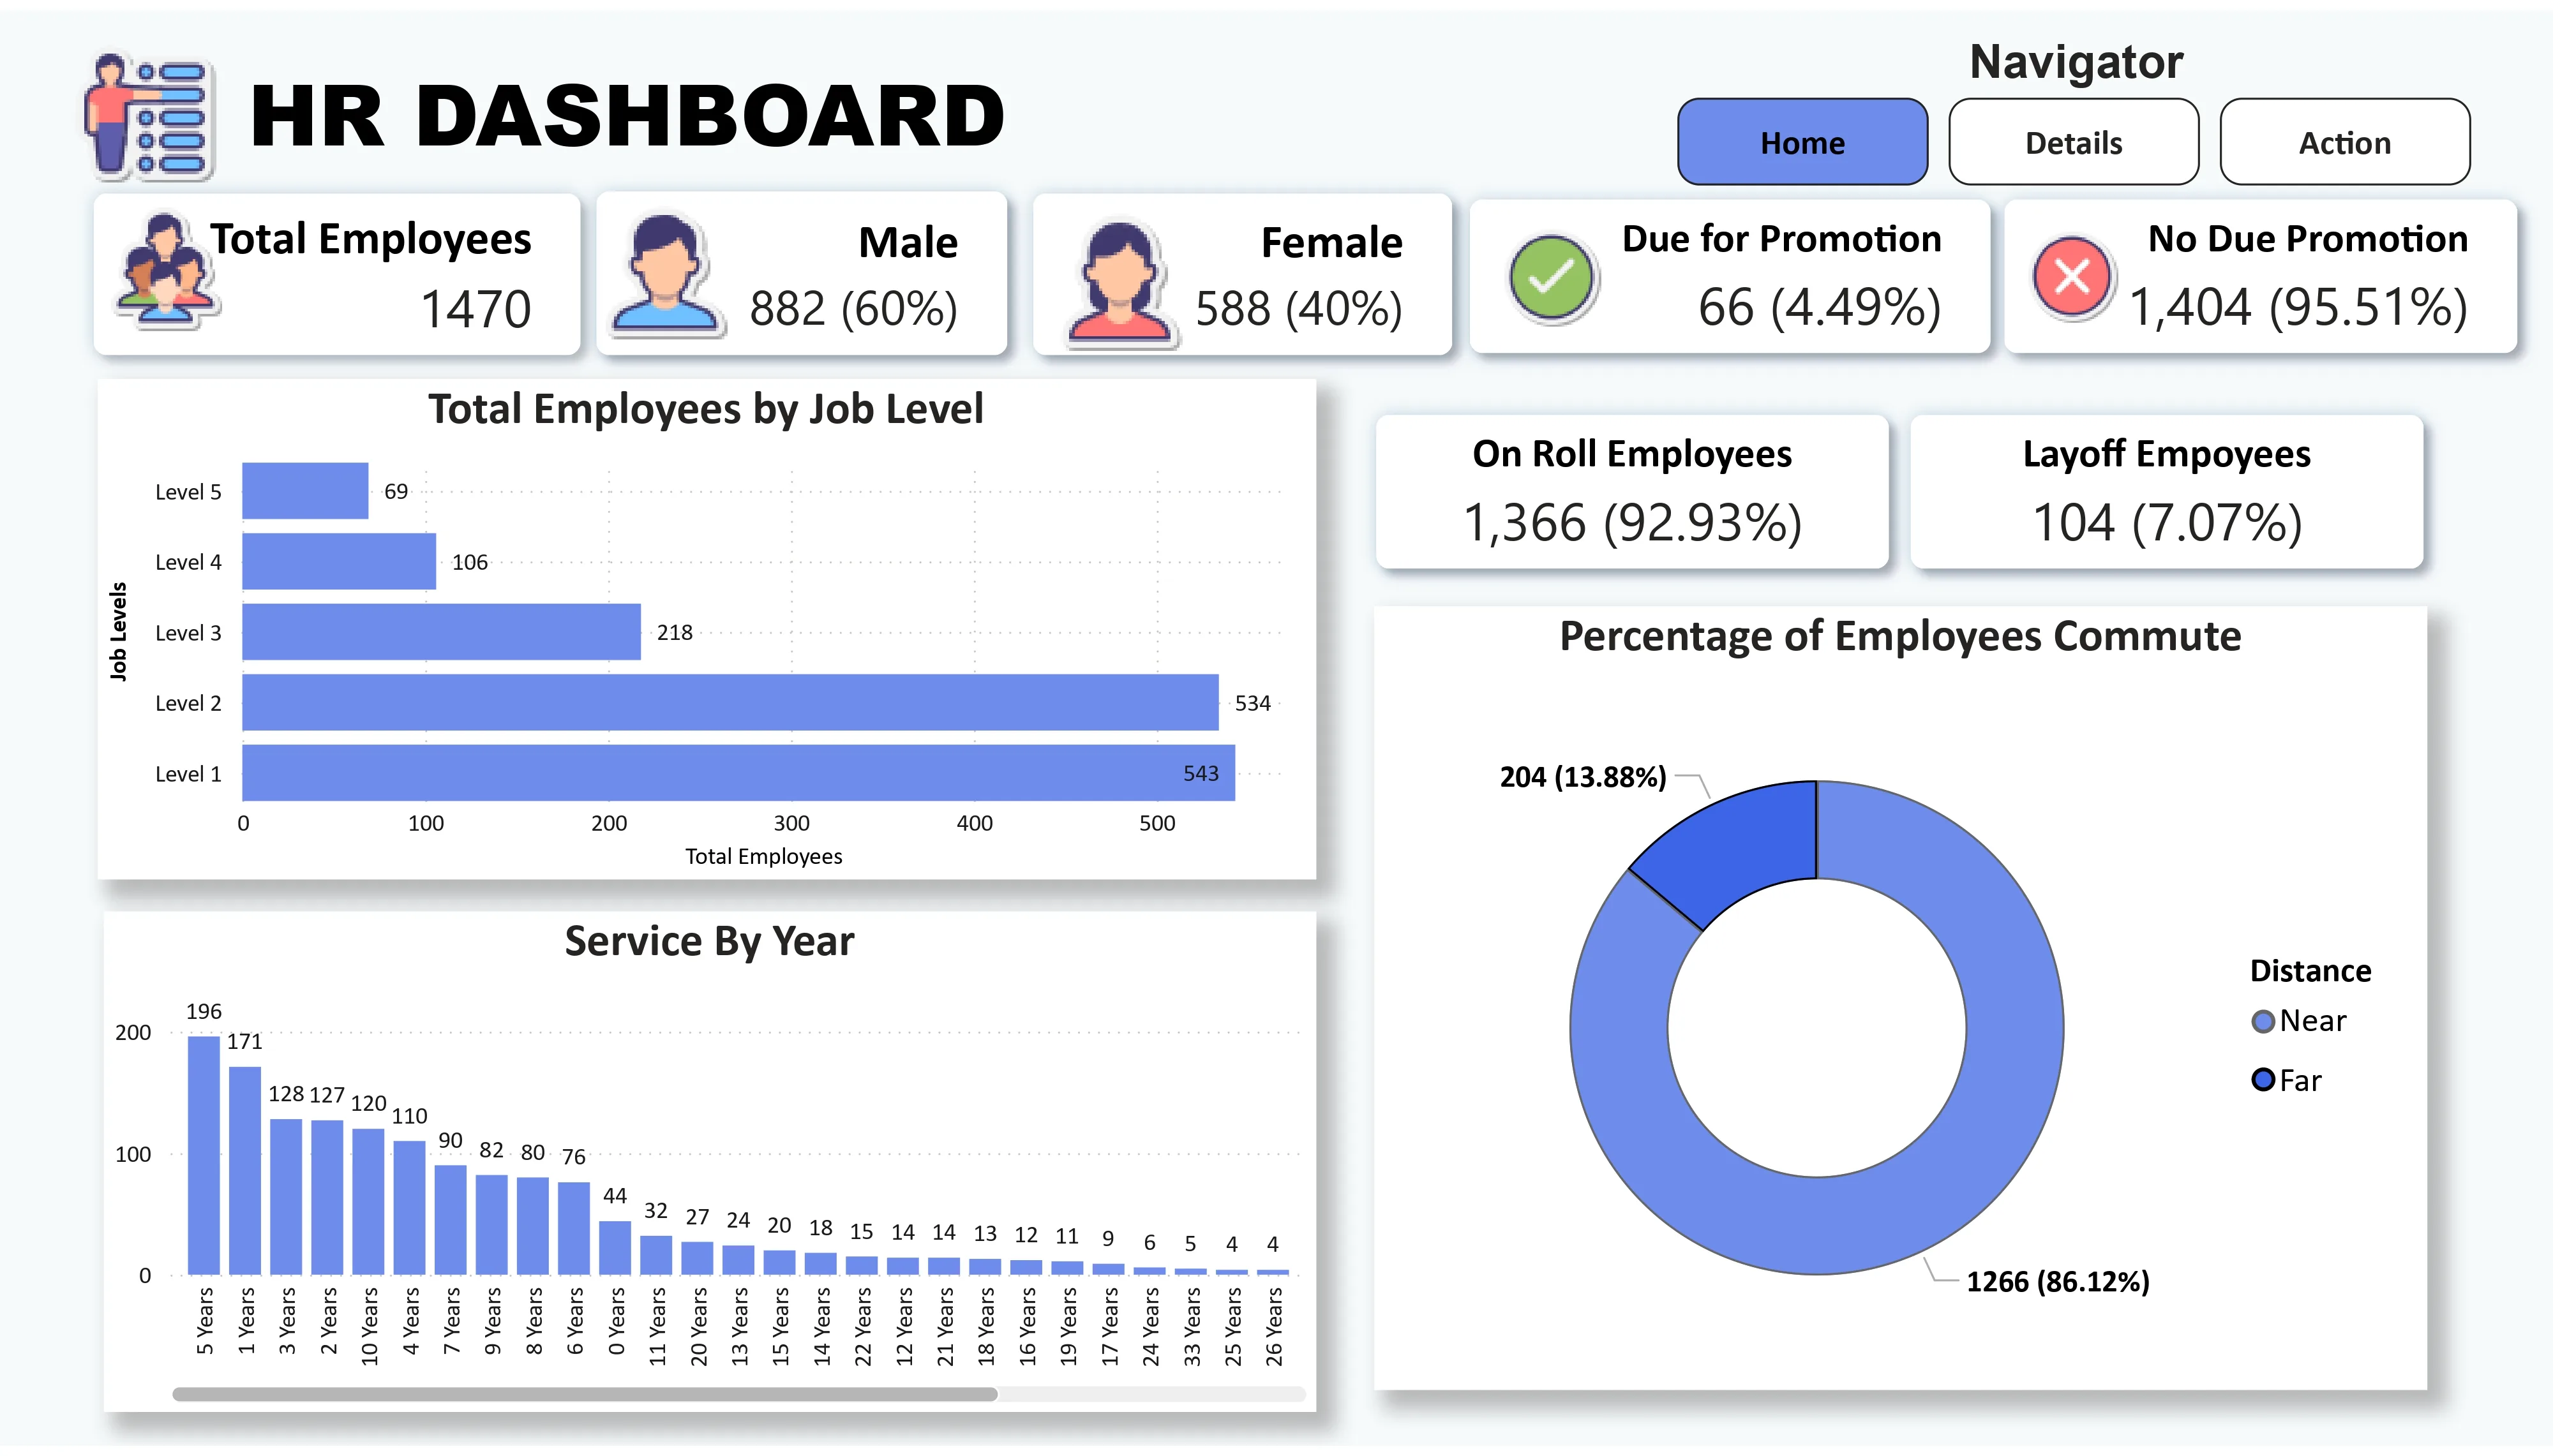
| Total employees | 1,470 |
| Due for promotion | 66 |
| Laid off | 104 |
| Job levels | 5 |
What the Dashboard Covers
| Page | Purpose |
|---|---|
| Home | Overall workforce mix and top-line KPIs |
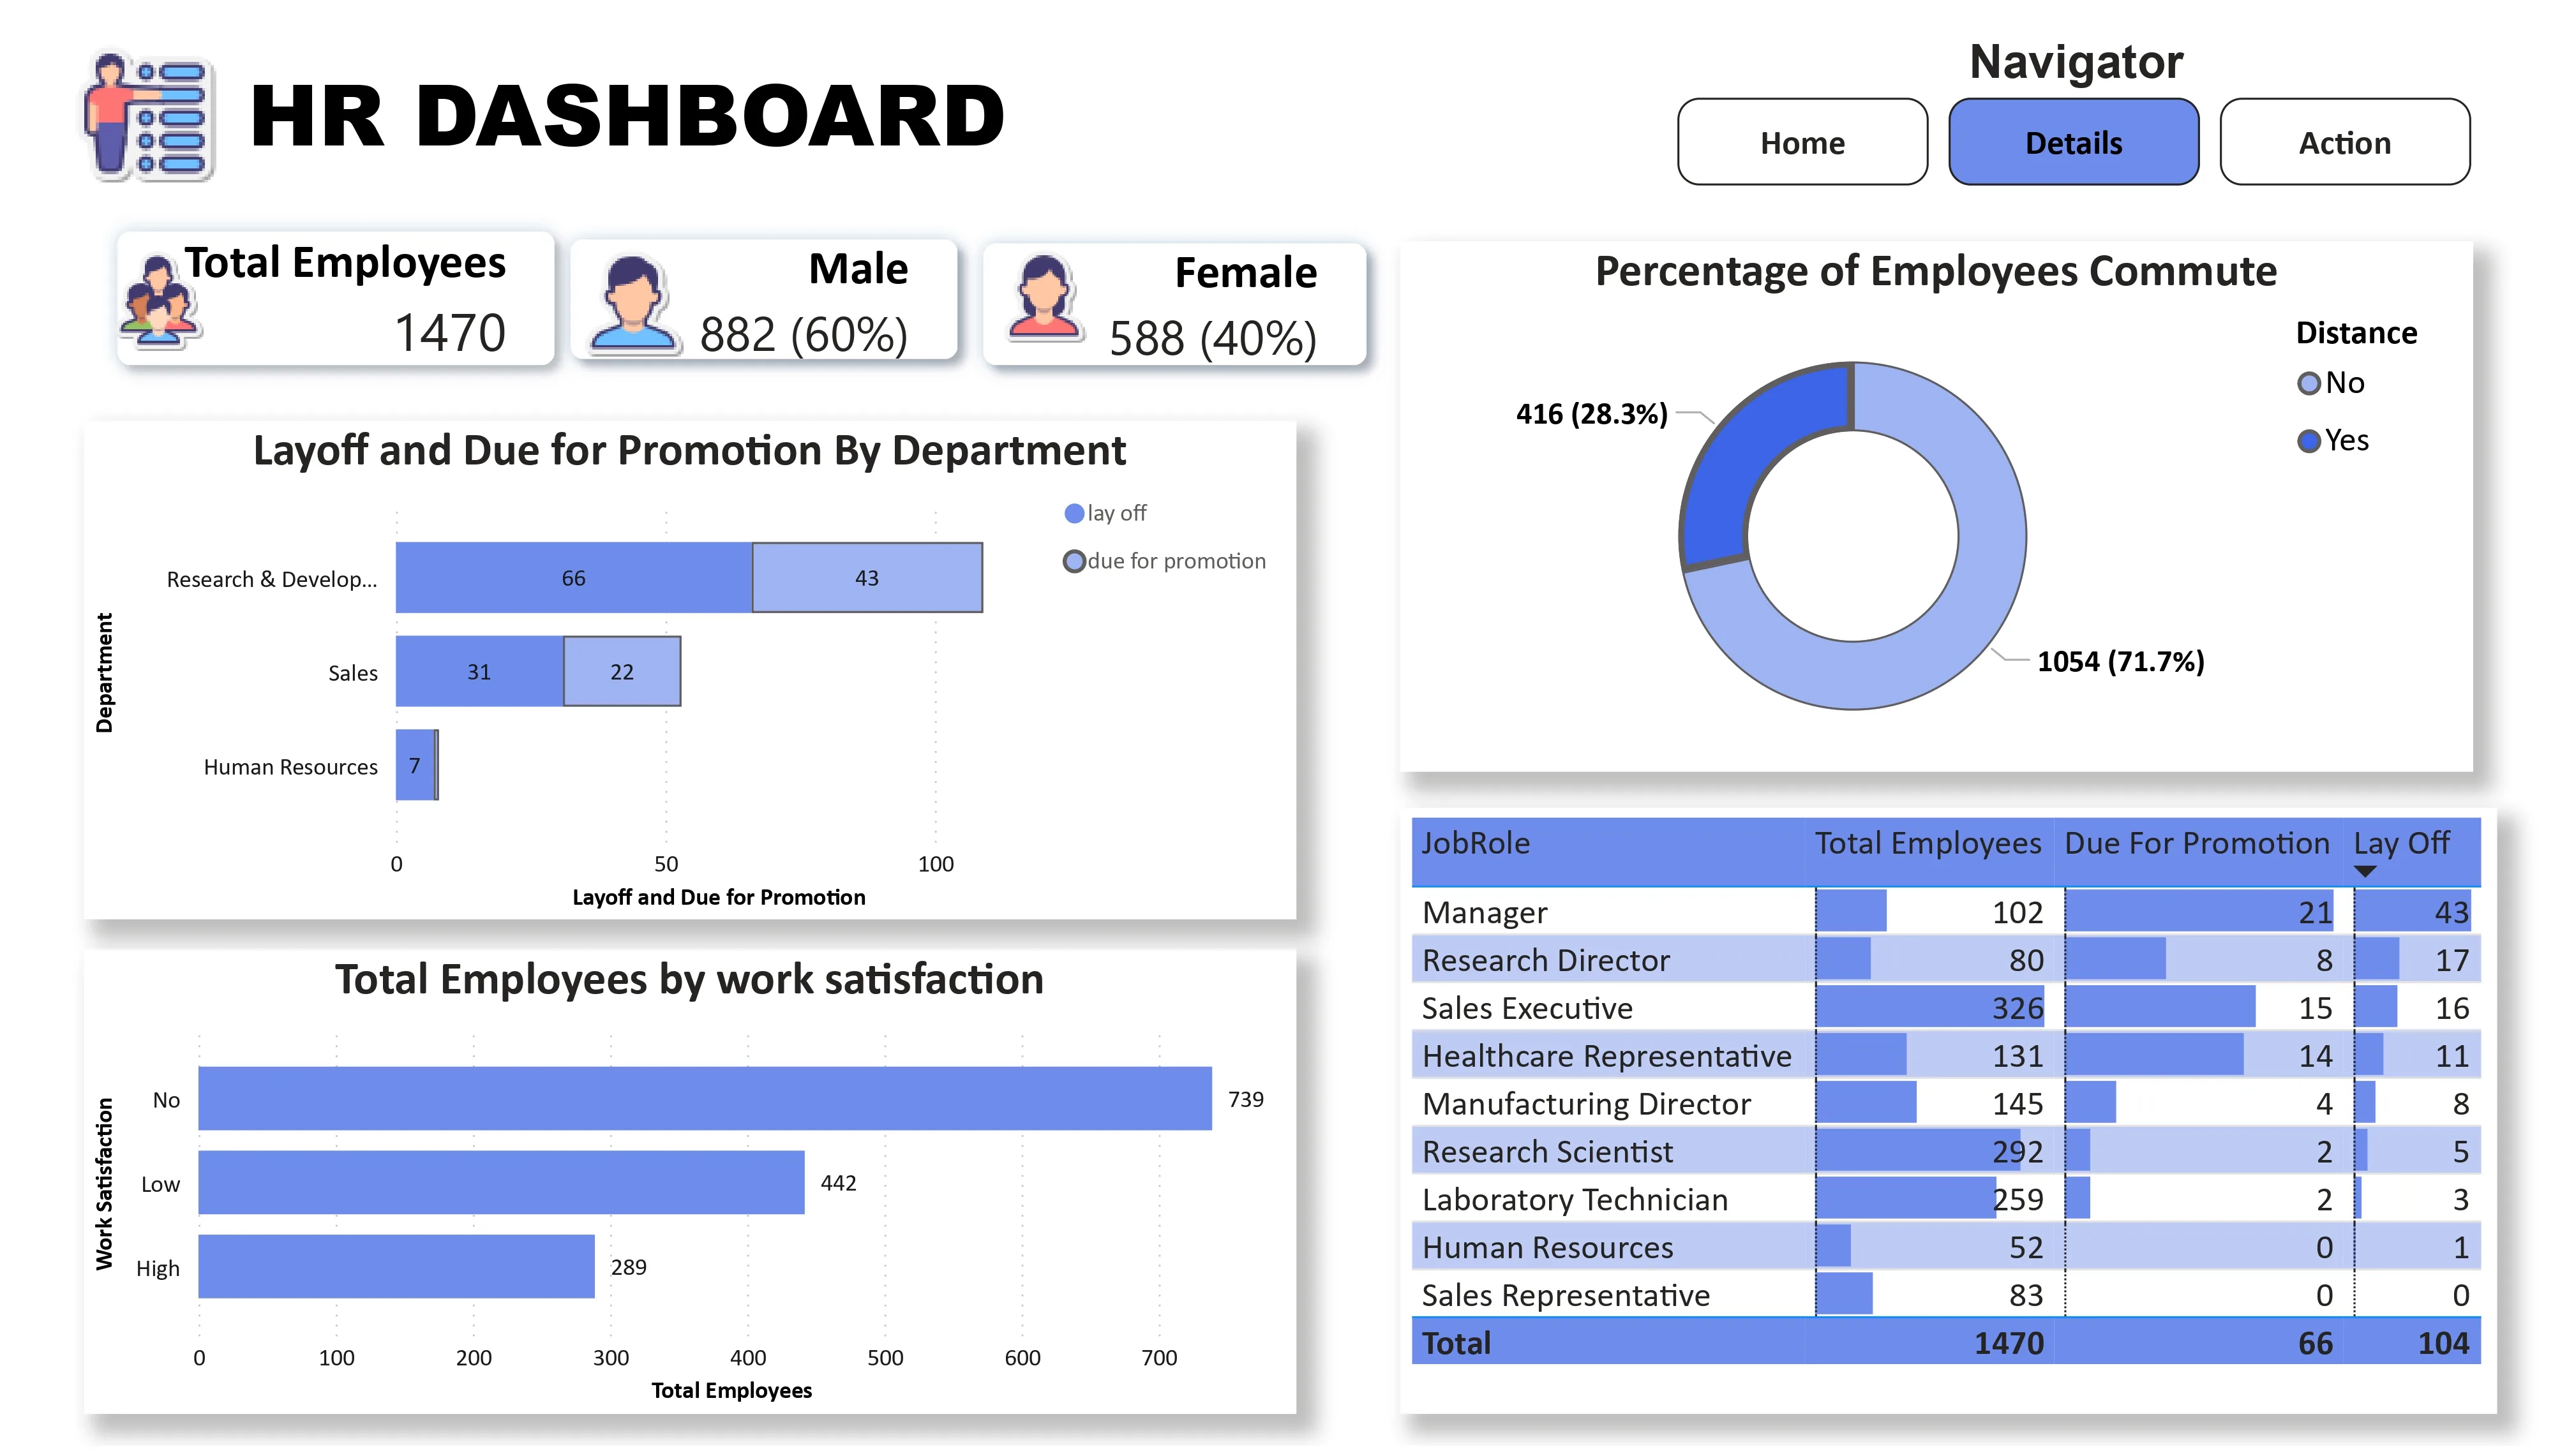
| Details | Department, role, commute, and satisfaction analysis |
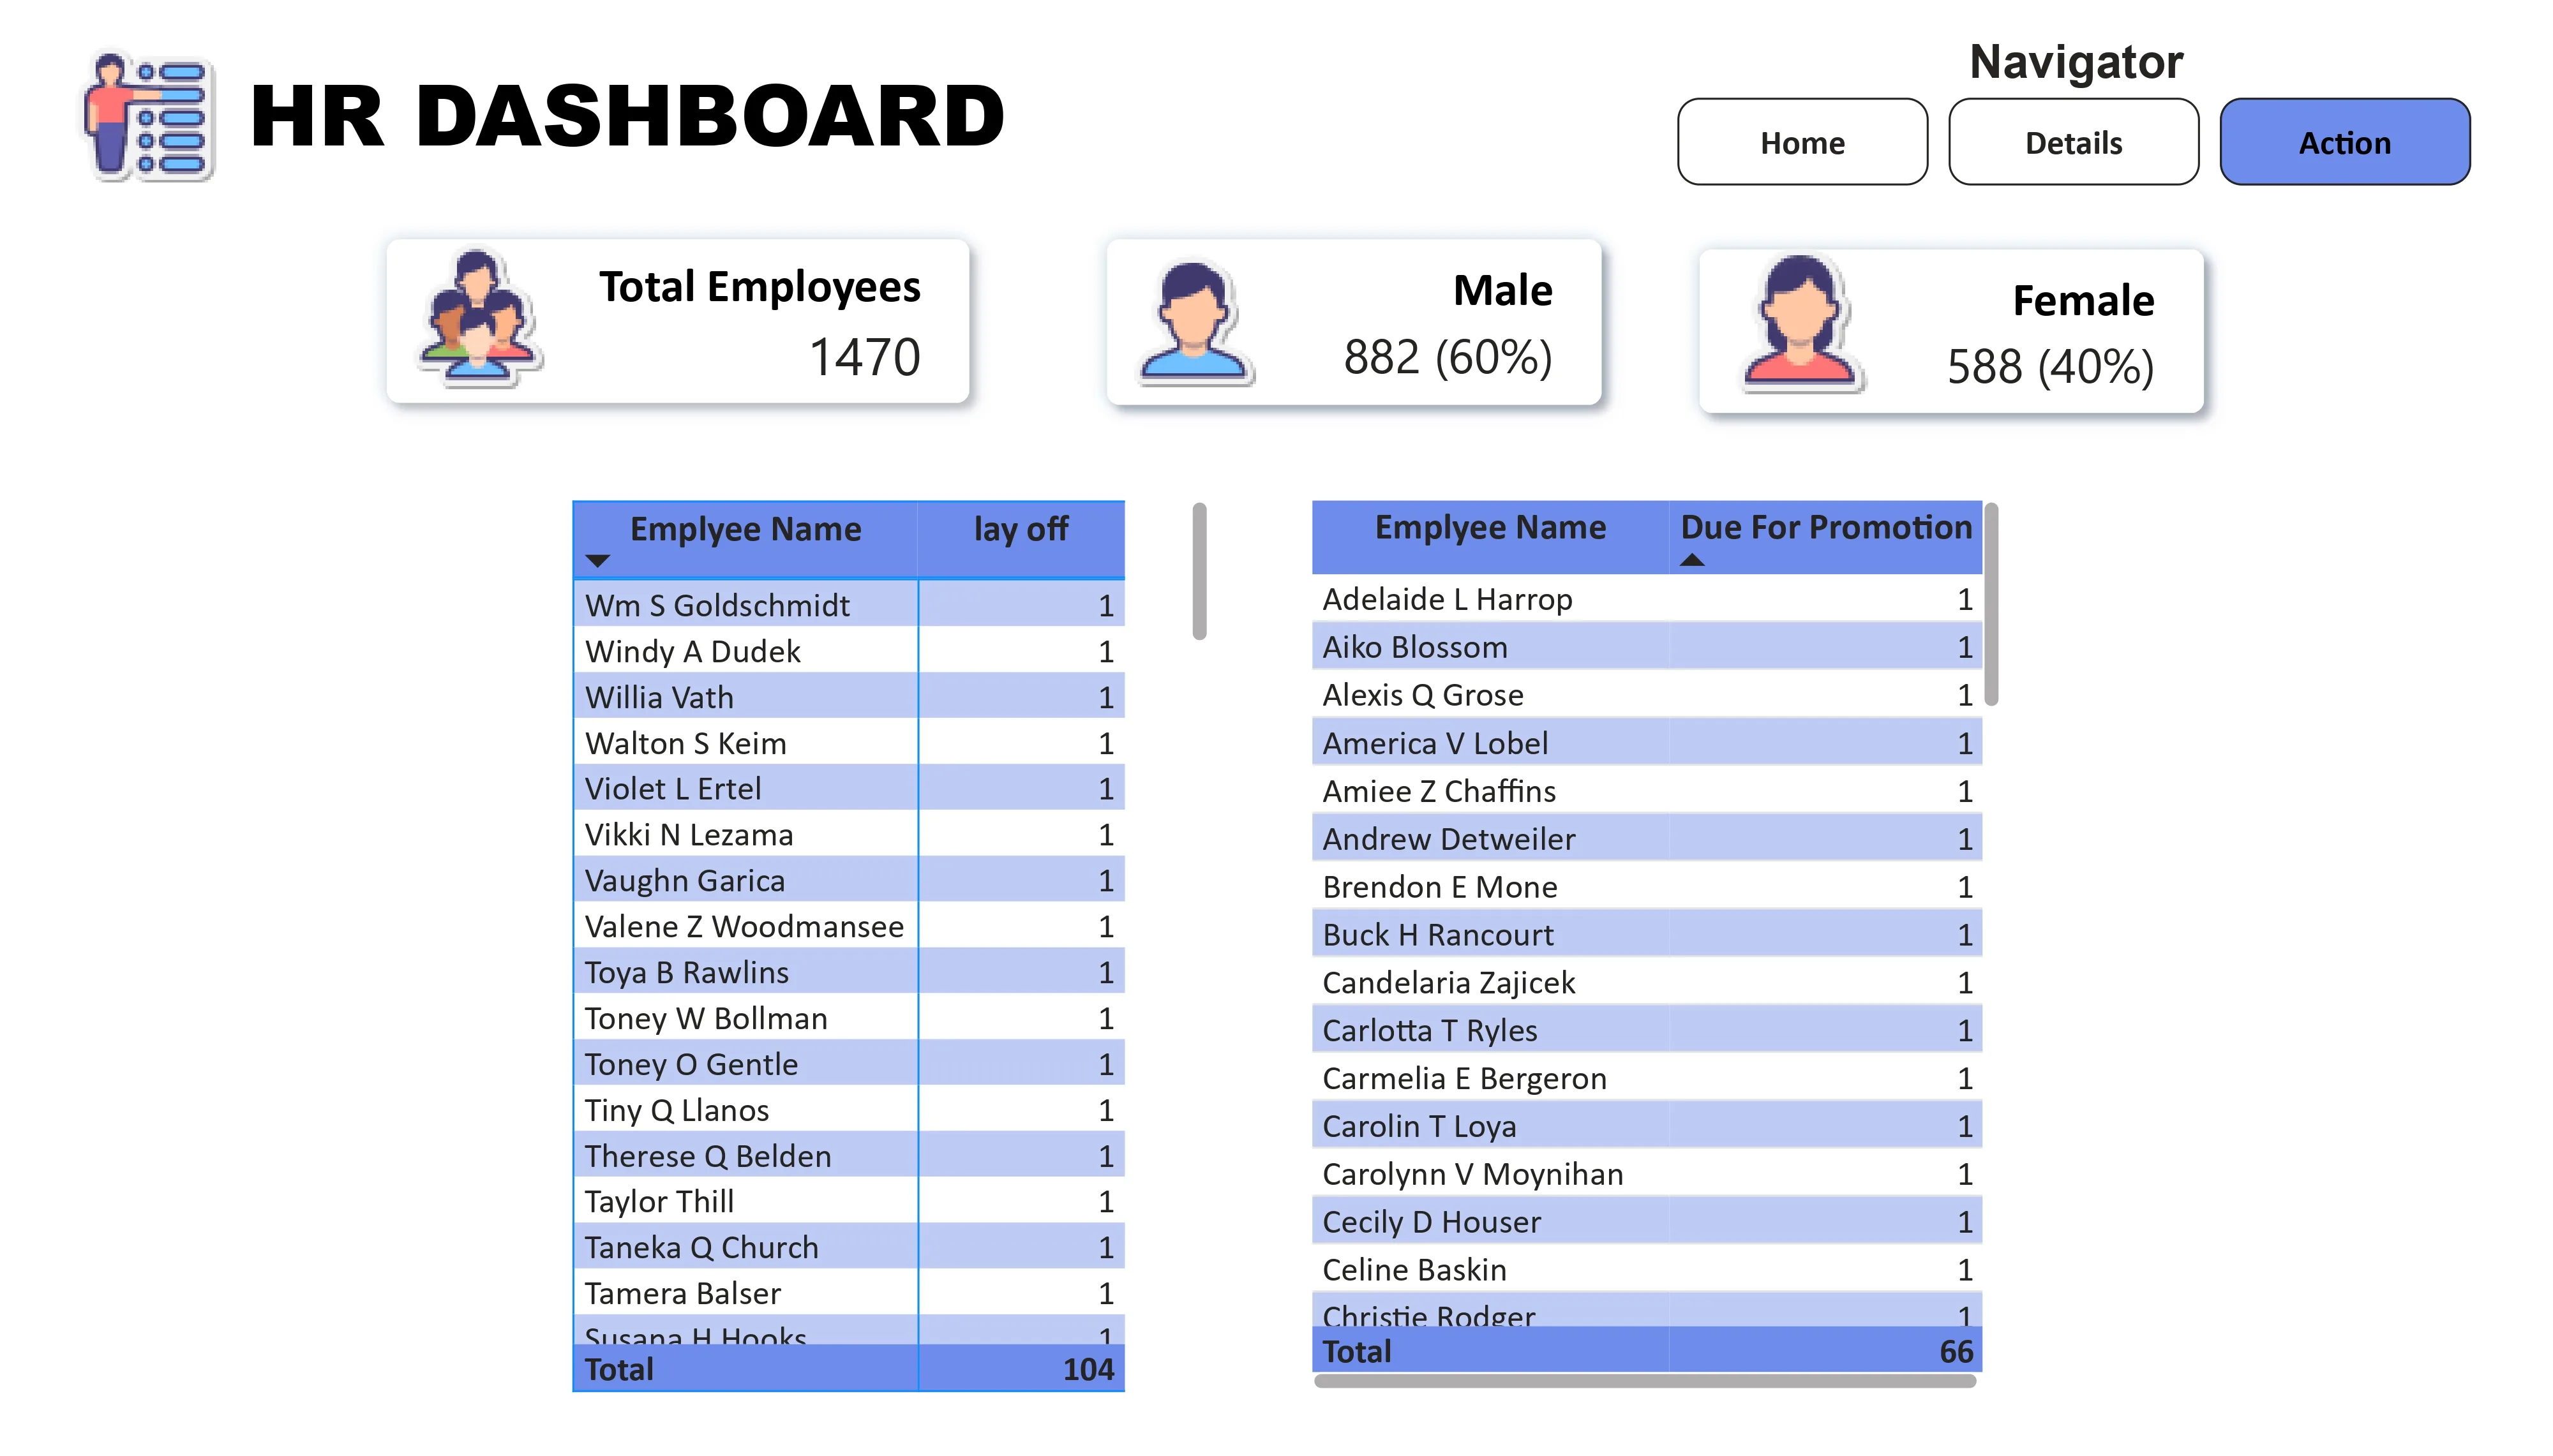
| Action | Lists of employees due for promotion or layoffs |
Findings
Workforce mix is concentrated at the lower job levels
The largest share of employees sits in Level 1 and Level 2 roles. That gives the company a clear pyramid shape, which is useful context when looking at promotion bottlenecks and leadership depth.
Promotion readiness is low relative to headcount
Only 4.49% of employees are marked as due for promotion. That can mean the pipeline is narrow, the criteria are strict, or the organization is not moving enough people upward.
Layoffs are not spread evenly
Layoffs are concentrated in specific roles and departments rather than being evenly distributed. Managers and research-heavy functions stand out most, which suggests targeted organizational change rather than broad churn.
Satisfaction data points to retention risk
The largest group in the dataset falls into the lowest satisfaction bucket. On its own that is not a diagnosis, but it is strong enough to justify deeper investigation by team, tenure, or function.
Tenure skews early-career
The workforce is concentrated in the 1-5 year range, with a thinner long-tenure tail. That usually points to a younger organization or one where long-term retention is still uneven.
Recommendations
For HR leadership
- Review promotion criteria and pipeline depth by department.
- Investigate low-satisfaction segments before they turn into attrition.
- Separate role-specific restructuring from broader workforce planning.
- Track managerial churn as a leadership-capacity signal.
For department heads
- Use promotion readiness as a planning metric, not just a reporting metric.
- Compare satisfaction and attrition indicators by team.
- Pay closer attention to mid-level career progression.
- Monitor tenure patterns when planning hiring and retention efforts.
Dashboard Preview
Outcome
The result is a Power BI dashboard that makes workforce structure, promotion readiness, and risk areas easier to inspect in one place. It is less about flashy visualization and more about giving HR stakeholders a practical way to read the organization.